EURUSD HOURLY
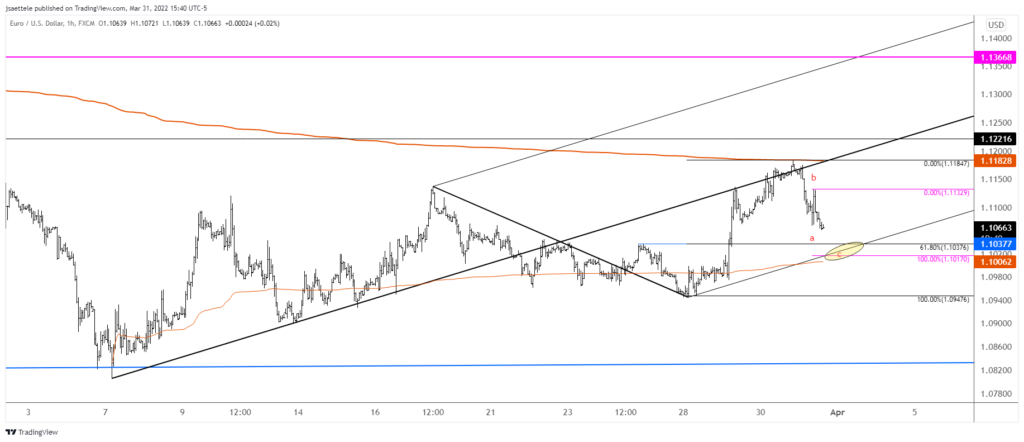
EURUSD appears to be completing an A-B-C decline from the 1.1185 high. The decline would consist of 2 equal legs at 1.1017 and the 61.8% retrace of the latest leg up is 1.1038. The lower parallel from the short term bullish fork is in line with these levels. Bottom line, look slightly lower before the next leg up gets underway.
3/30 – 1.1218/30 remains in focus but I’m wondering if EURUSD is trading within a much more bullish structure. Notice how price has been riding the median line of the presented fork the last 2 days. This suggests that the structure is ‘in play’. So, either price pulls back and finds support on a related parallel…probably near 1.1106 or 1.1060 or EURUSD explodes higher now. If the latter happens, then the top side of the center line becomes proposed support.
AUDUSD DAILY
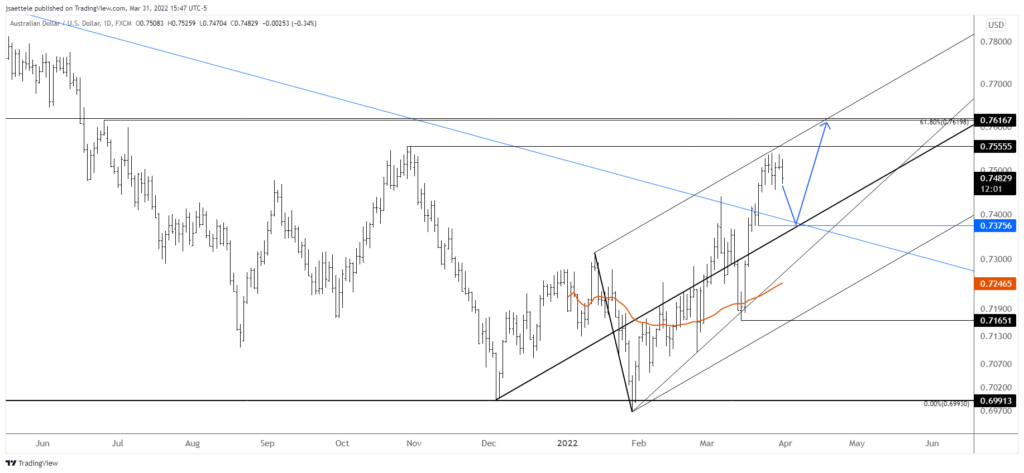
AUDUSD has been churning sideways for the last week in what I still think is a short term top. I remain of the view that the larger trend is higher and that a pullback, probably into .7375 or so (top side of the 2021 trendline), will offer a splendid opportunity to position on the long side.
3/28 – Aussie may finally be about to pull back and in turn provide us with the chance to get long. I’m still thinking that ideal support is the top side of the 2021 trendline (blue line), which was resistance in early March. That line is about .7390 now.
Do you make a profit trading AUD/USD?
Try our funded trader program and get up to $1,000,000 in funding.Learn more
USDJPY HOURLY
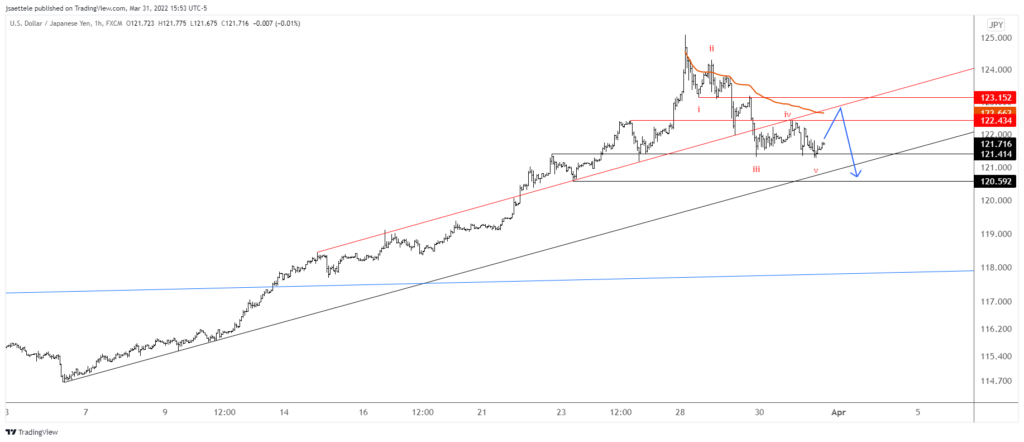
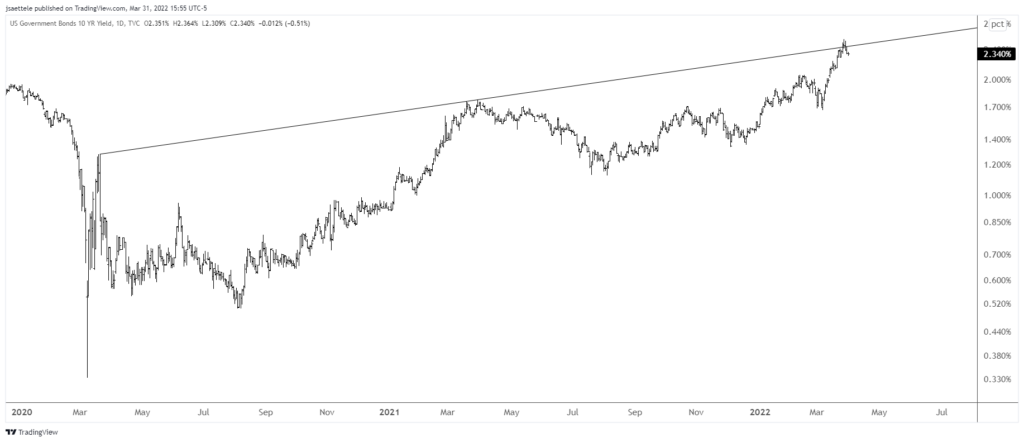
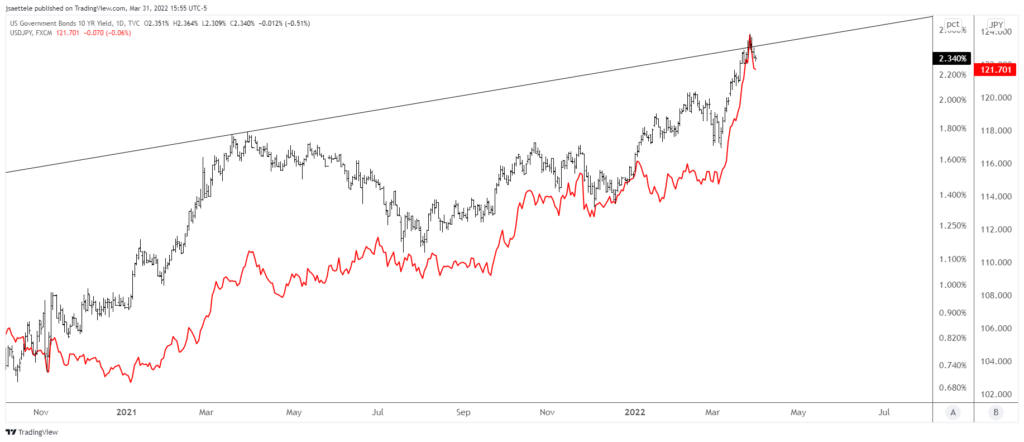
USDJPY continues to follow the short term script. That is, 5 waves down are either complete or nearly complete. The implication is that price bounces into 122.43-123.15 before another leg lower unfolds. Pay specific attention to the red trendline, which crosses highs and lows since mid-March. If you want a ‘reason’ to think lower in USDJPY from up here, then take a look at the U.S. 10 yr yield (see next 2 charts).
3/30 – A possible short term count for USDJPY is shown. Under this scenario, a small 4th wave would end near 122.40 before a 5th wave drop into 120.40/60. At that point, a larger 3 wave bounce would take place into a lower high (against this week’s high).
U.S. 10 YR YIELD DAILY
U.S. 10 YR YIELD (BLACK) AND USDJPY (RED) DAILY
EURCAD HOURLY
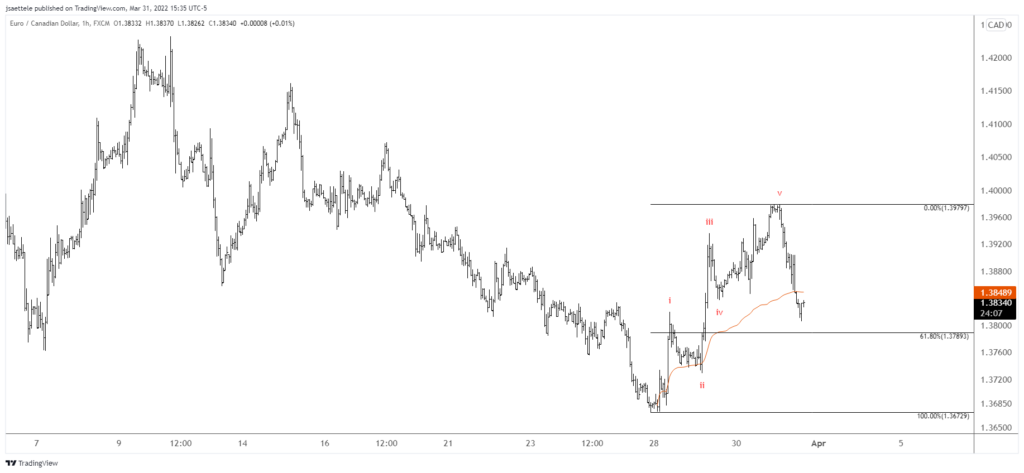
EURCAD is working on a weekly key reversal. A detailed look at price action reveals an impulsive (5 waves) advance from the low. The implication is that a higher low should form. Watch for support at 1.3789.
EURAUD HOURLY
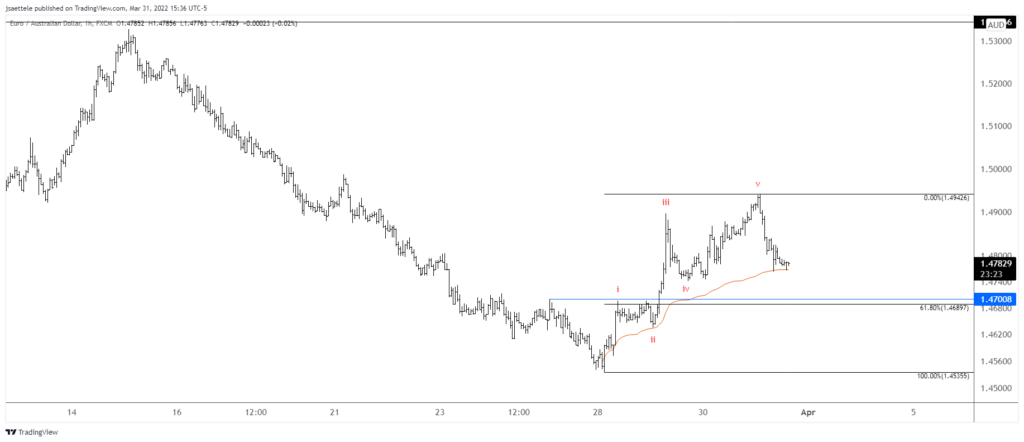
EURAUD is nearly identical to EURCAD on a near term basis. That is, 5 waves up from the low are visible. As such, focus is on identifying a higher low. 1.4690-1.4700 is an ideal spot for that higher low to form. This is the 61.8% retrace and former resistance.