EURUSD WEEKLY
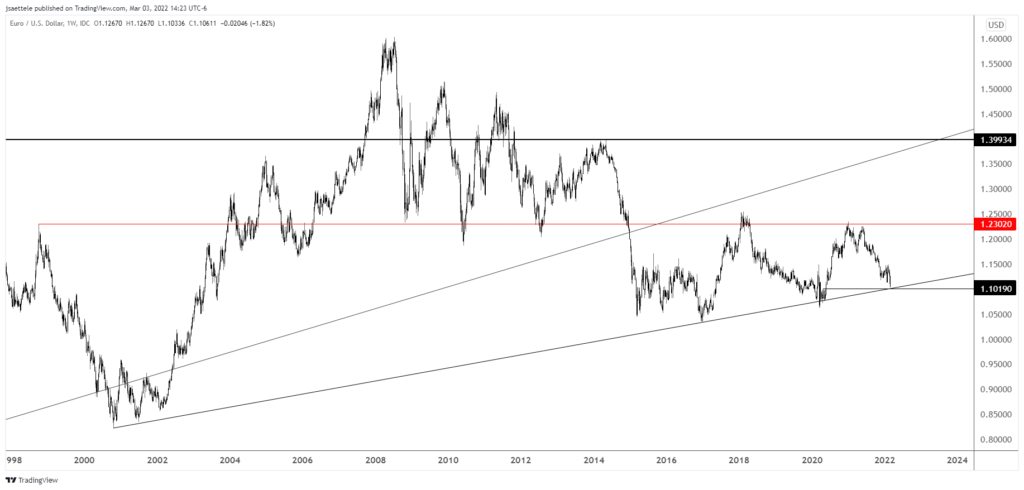
Consider today’s update the ‘long term trendline edition’. NFP is tomorrow and I’ve witnessed many turns from stretched markets over the years following an NFP spike. In this instance, that would be a spike towards USD strength (EURUSD weakness). Interestingly, EURUSD is closing in on a 22 year trendline! This is the same trendline that was support for the 2020 low. A close up is below…the trendline is about 1.1000/20. This is also the 78.6% retrace of the rally from the 2020 low.
EURUSD DAILY

USDJPY WEEKLY
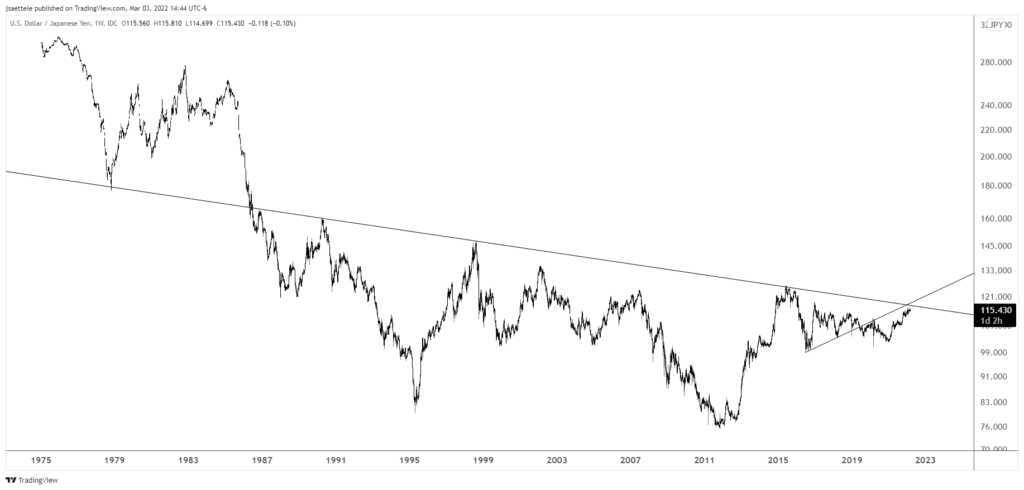
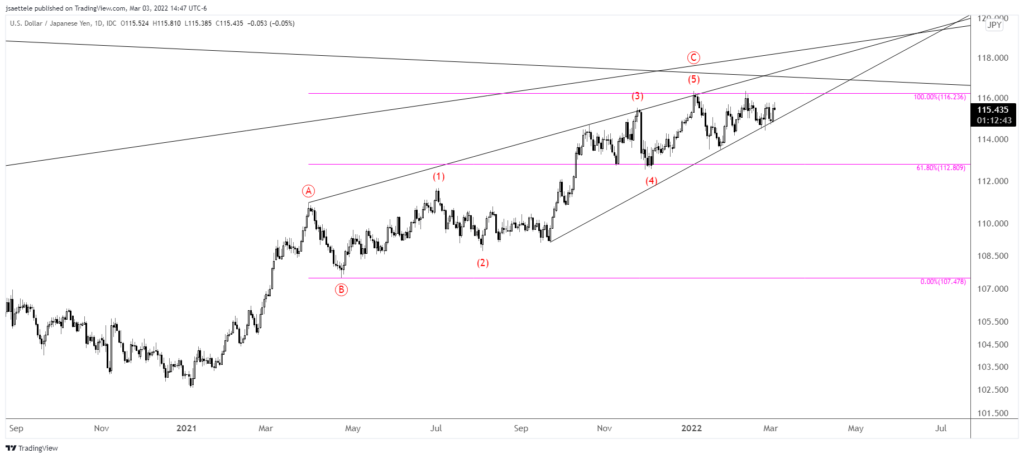
USDJPY has done nothing since November. A 32 year trendline is slightly above the market…at about 117.25. I have no idea if we get there but pay attention to the daily chart below. Action over the last year constitutes a rising wedge (see daily chart below). The lower barrier is about 114.90 (basically this week’s low). If that breaks then the short side is viable. Until then, it’s a waiting game.
USDJPY DAILY
CRUDE OIL (WTI) WEEKLY
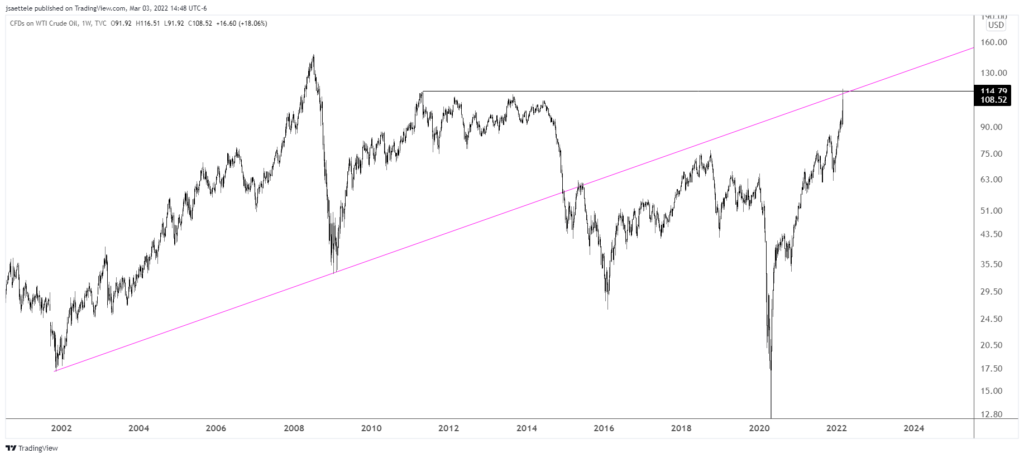
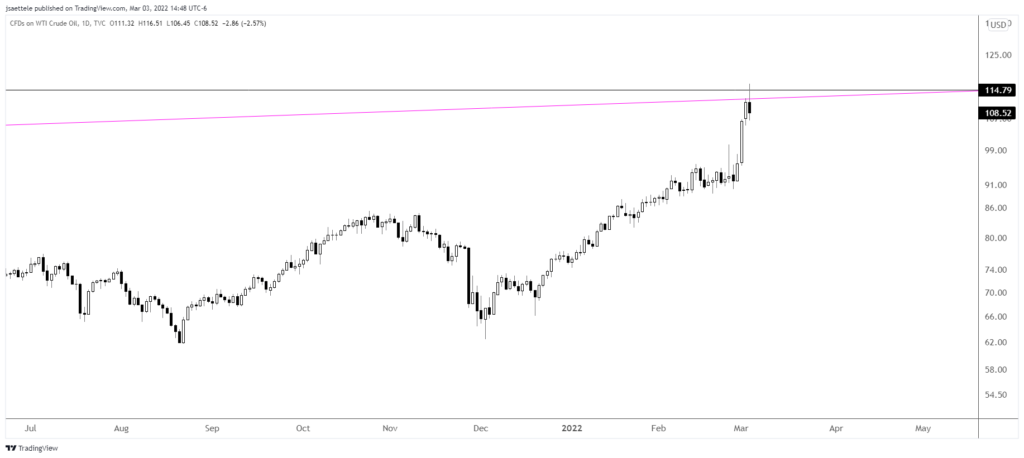
Crude poked above the 2011 high today before reversing lower (see daily chart below). This is also the trendline from the 2001 low, which was resistance in 2015. This is a scary market to be sure but I can’t think of a better place for a reversal than right now.
CRUDE OIL DAILY
CRUDE OIL (BLACK) AND CADJPY (ORANGE) DAILY
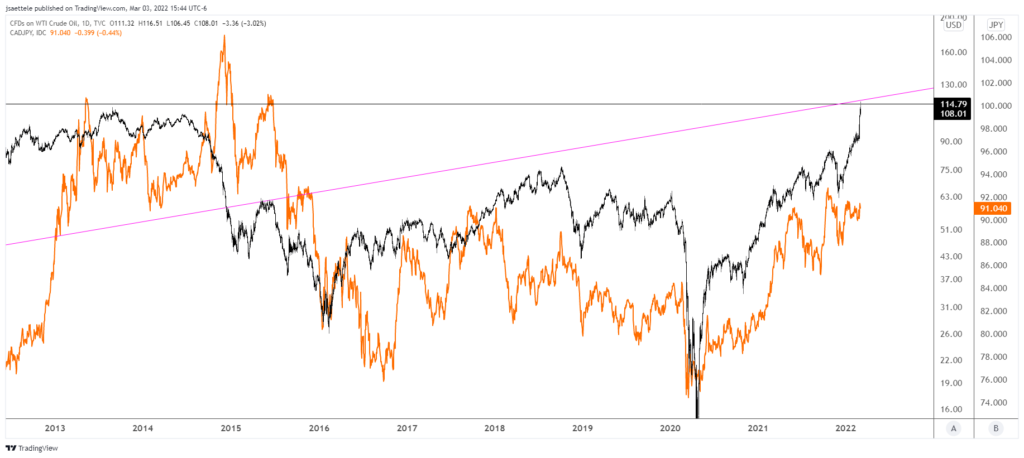
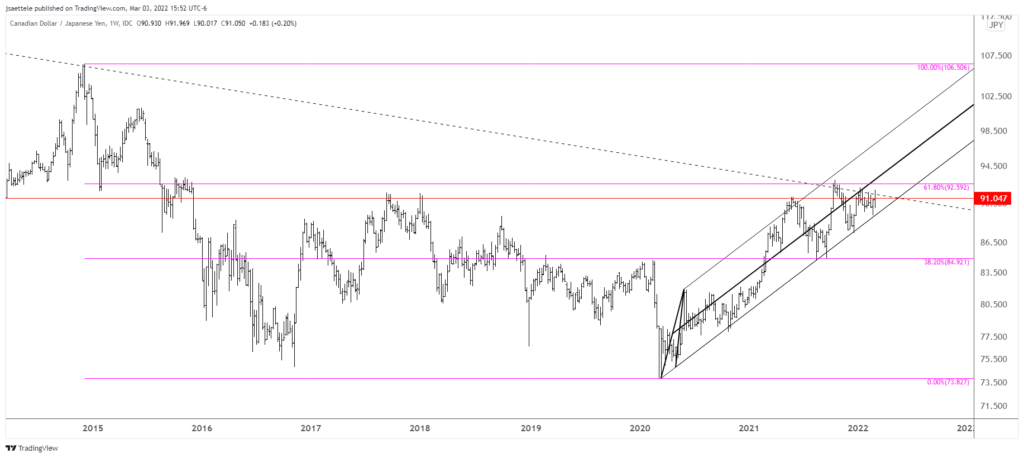
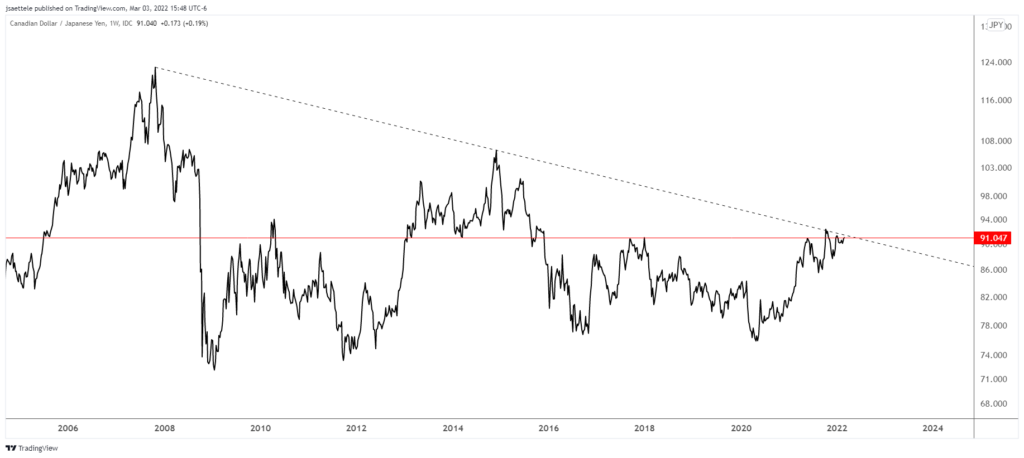
IF crude is turning lower THEN short CADJPY could be huge. The weekly chart below highlights the trendline from 2007 (drawn off of closes). Also, the October 2021 high is right at the 61.8% retrace of the decline from 2014 and price channels beautifully from the 2020 low. It’s possible of course that a massive breakout occurs from here but the crude ‘blow-off’ top look has me thinking the other way.
CADJPY WEEKLY
CADJPY DAILY