NASDAQ FUTURES (NQ) DAILY
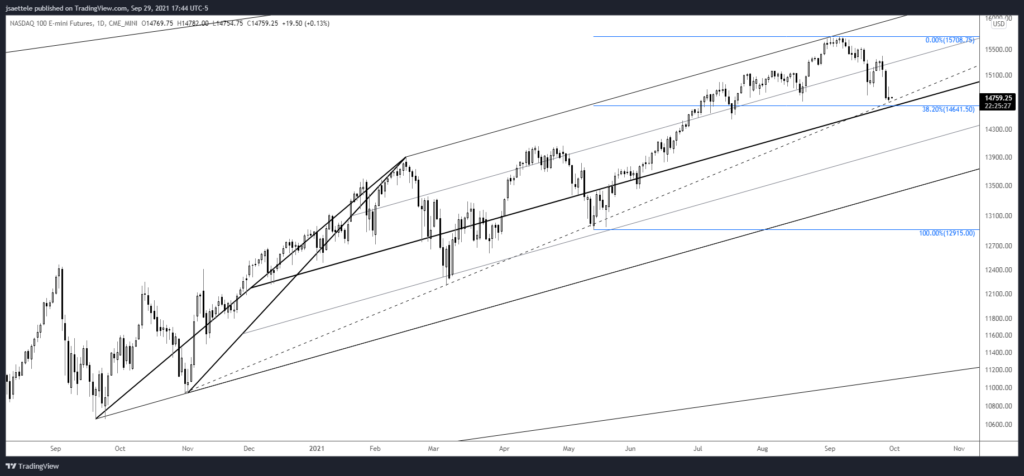
NQ is nearing the trendline from the November low. This is also the center line of the channel from the September low (the upper parallel was resistance so it would be ‘natural’ for price to react to the center line) and the 38.2% retrace of the rally from the May low (14641.50). Bottom line, this is an important test for NQ and a break below would indicate an important behavior change.
USDOLLAR DAILY
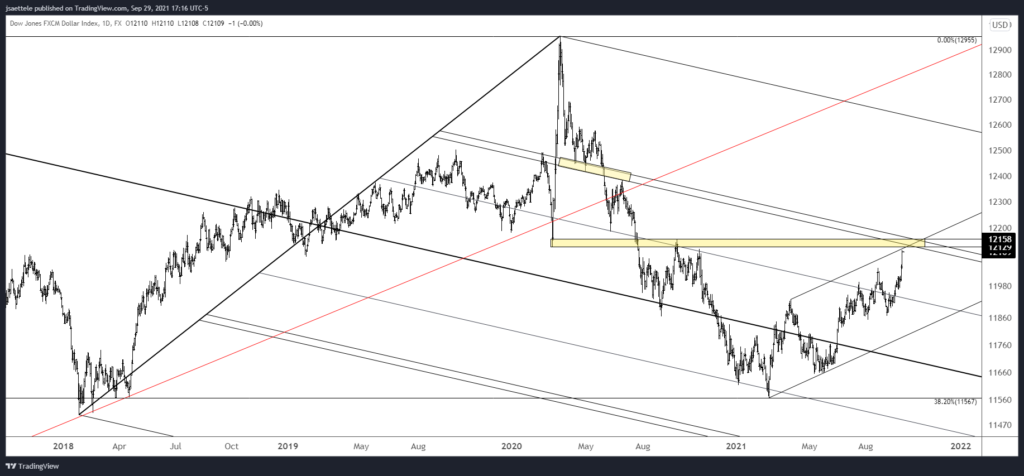
USDOLLAR is closing in on the LONG HELD decision point of 12130/60. This is a HUGE level and I’d be surprised if we don’t see a decent reaction lower…at least initially.
9/21 – In my view, USDOLLAR has broken out and is headed to 12130/60 (the next decision point). IF price pulls back (not or later), then the parallel that has been support/resistance since June 2020 (magenta line) is proposed support along with the 50 day average at 11940. That could happen on Wednesday with FOMC, at a later date, or not at all! Bottom line, 11940 is proposed support and I’m looking towards 12130/60.
DXY DAILY
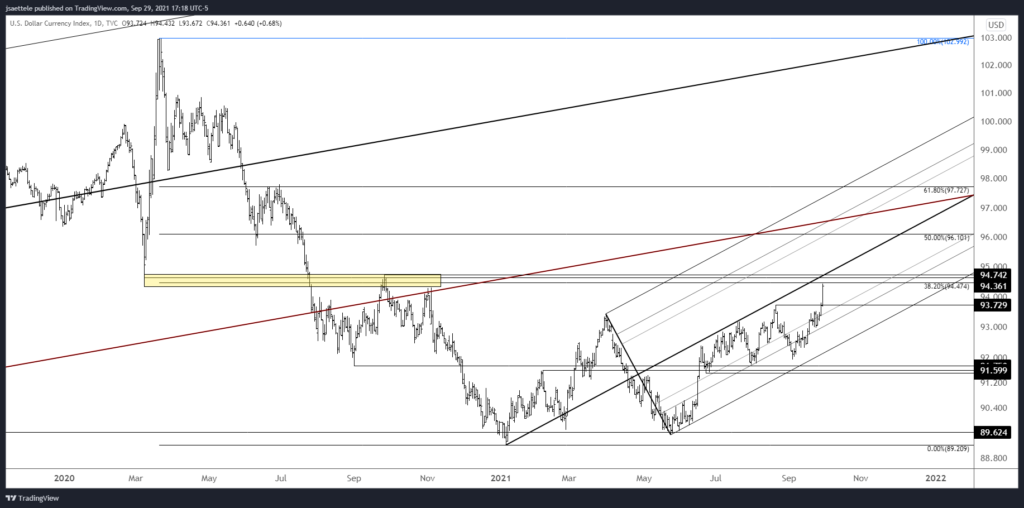
DXY is also into the bottom of its longer term possible resistance zone (remember the long term page?). 94.47/74 includes the 38.2% retrace of the decline from March 2020, the September 2020 high (also the former 4th wave) and the March 2020 low. HUGE level and I do expect a reaction and possibly a more important reversal lower. Wait and see.
EURUSD DAILY
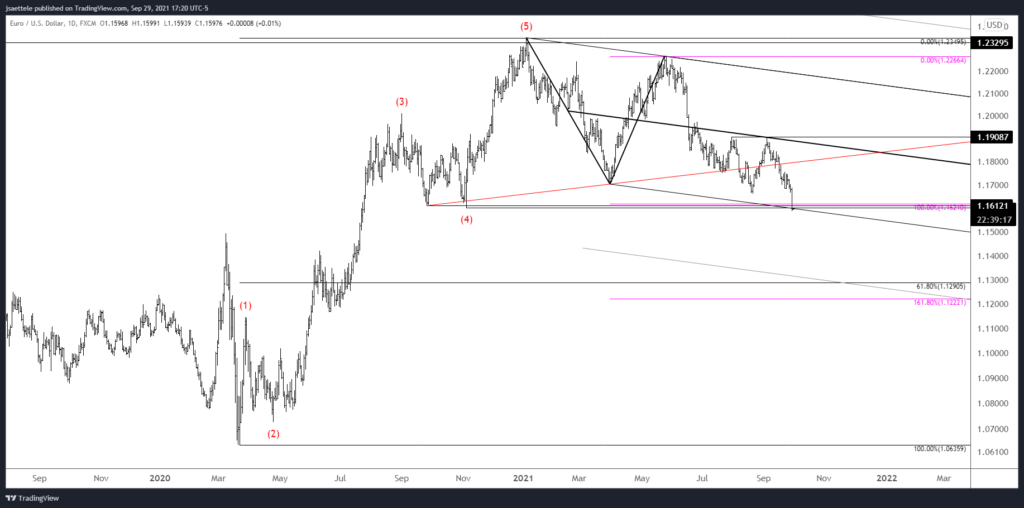
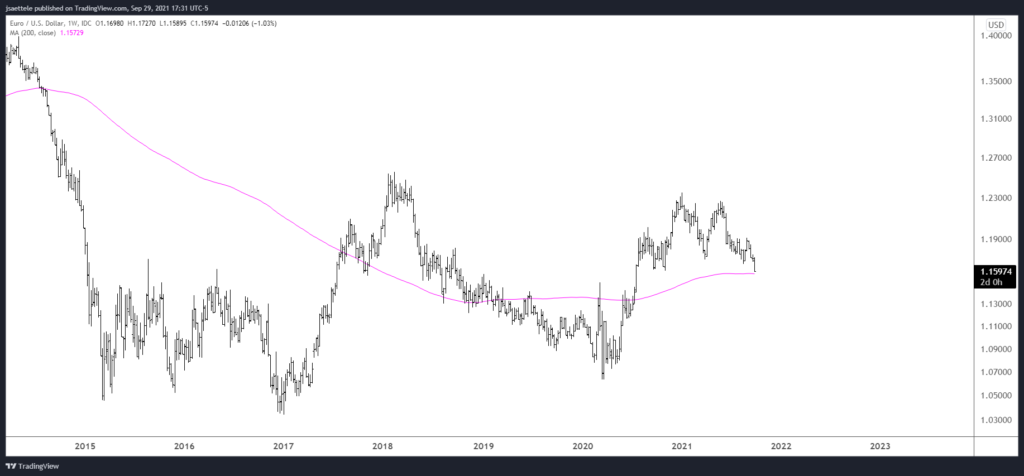
With USDOLLAR and DXY testing key levels, it’s no surprise that EURUSD is also testing a key level. Again, 1.1600 is the November (election) 2020 low, 2 equal legs down from the January high, and channel support. Also, the 200 week average is just below (see below). The level is extremely well-defined by this chart looks insanely bearish. Wait and see what happens here. If we break lower then the underside of the channel would become resistance near 1.1600. If we bounce then the first level to pay attention to is 1.1660s.
9/22 – FOMC didn’t change much for EURUSD. I was hoping for a rally into 1.1790 to short but that could still happen. More importantly, be aware of expected support at 1.1600/20. The level is huge. This is the former 4th wave low (Sep 2020 and Nov 2020 election lows) and corrective channel support. The top of the zone is 2 equal legs down from the January high.
EURUSD WEEKLY
USDCAD 4 HOUR
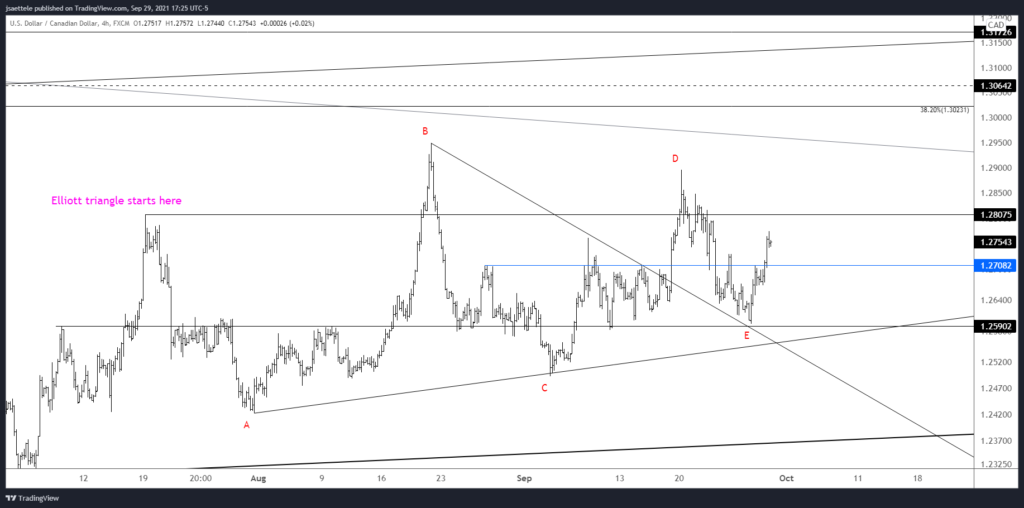
The only additional comment I have for USDCAD is to point out that 1.2708 is well-defined for support now and therefore a long entry.
9/28 – My view is that USDCAD completed the triangle today. The implication is that price heads higher and eventually breaks above the August high. 1.2800ish is still possible resistance within the range. Bottom line, I’m bullish.