SPY WEEKLY
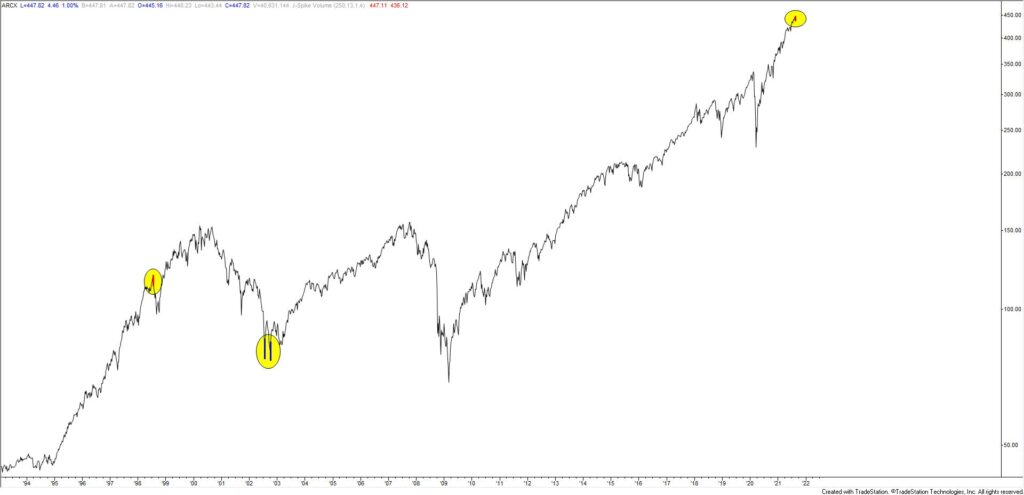
SPY made a volume reversal last week. The red and blue bars on the chart indicate volume reversals at at least 5 year highs/lows. The signal is rare. Proposed resistance levels for ES and NQ futures (see next 2 charts) are about 4500 and 15460.
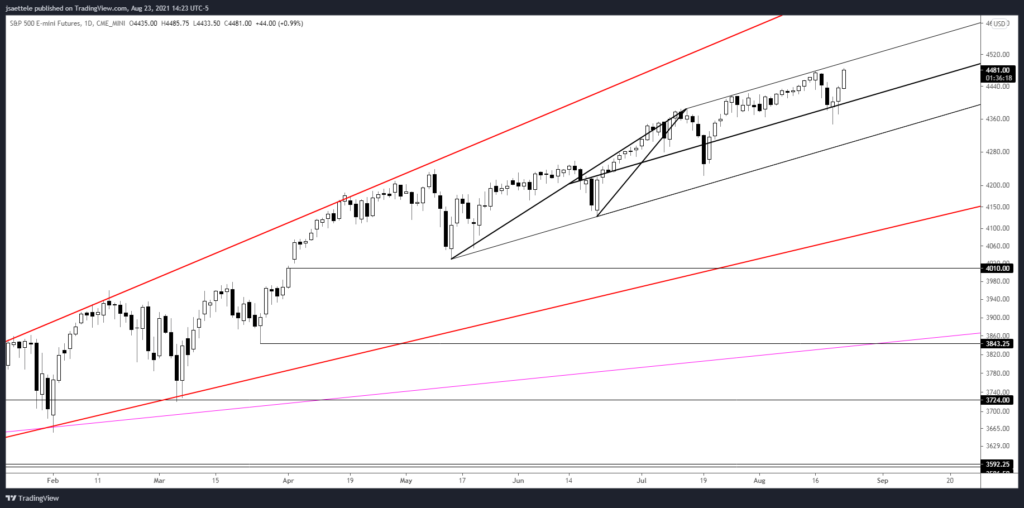
S&P 500 FUTURES (ES) DAILY
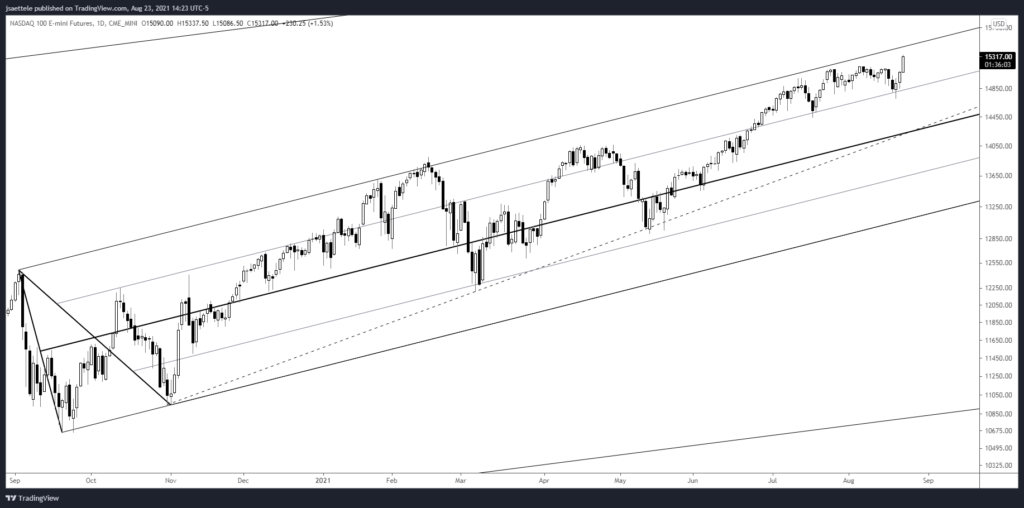
NASDAQ FUTURES (NQ) DAILY
SPOT SILVER DAILY
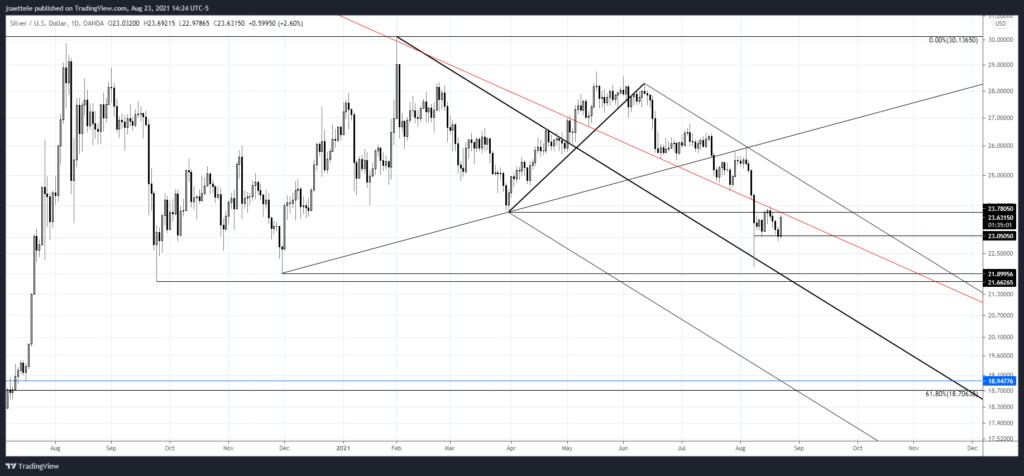
Silver is again nearing the red parallel that was resistance last week. Price did test the 8/12 low last week so a double bottom is possible. A break above the parallel would signal a bullish behavior change and the top side of that line would become proposed support.
8/18 – Silver has responded to the noted red line. Extend the line to the left and you’ll notice that the line crosses pivots going all the way back to the high! In other words, ‘the market made this line’. Bottom line, silver looks like death…as long as price is under yesterday’s high.
USDOLLAR DAILY
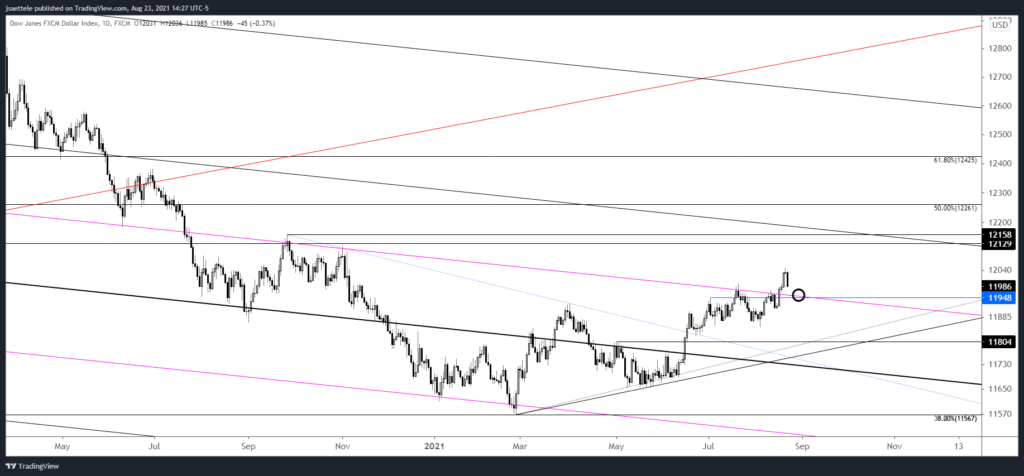
USDOLLAR is pulling back sharply following the breakout last week. This is still a breakout but support needs to register from the magenta parallel (formerly resistance) near **11950 **in order to maintain a bullish outlook.
8/17 – The USDOLLAR pullback bottomed at 11911…just above 11900. Is this a massive breakout? It is until it isn’t (then it would be a failed breakout). Risk is higher until noted otherwise with focus on 12129/60.
NZDUSD DAILY
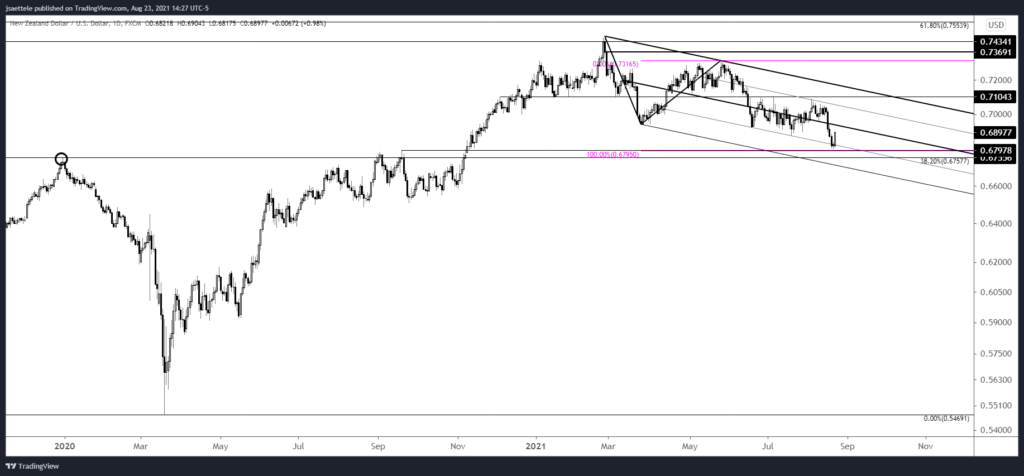
NZDUSD bottomed 5 ticks above .6800 (VWAP from March 2020 low…see below)! Again, price continues to oscillate between the 25 and 75 lines of the channel from the February high. Immediate focus for resistance is the median line near .6935. Watch for support near .6860.
8/17 – NZDUSD eyes remain on .6800 (or so). Recall that .6800 is 2 legs down from the February high AND VWAP from the 2020 low. The bottom of the channel is now about .6700 so let’s call .6700-.6800 a critical zone. The high volume capitulation logic explained regarding AUDUSD applies to Kiwi (see futures chart below). Proposed resistance is .6950/65 (former support and month open).
NEW ZEALAND DOLLAR FUTURES DAILY

USDCAD WEEKLY
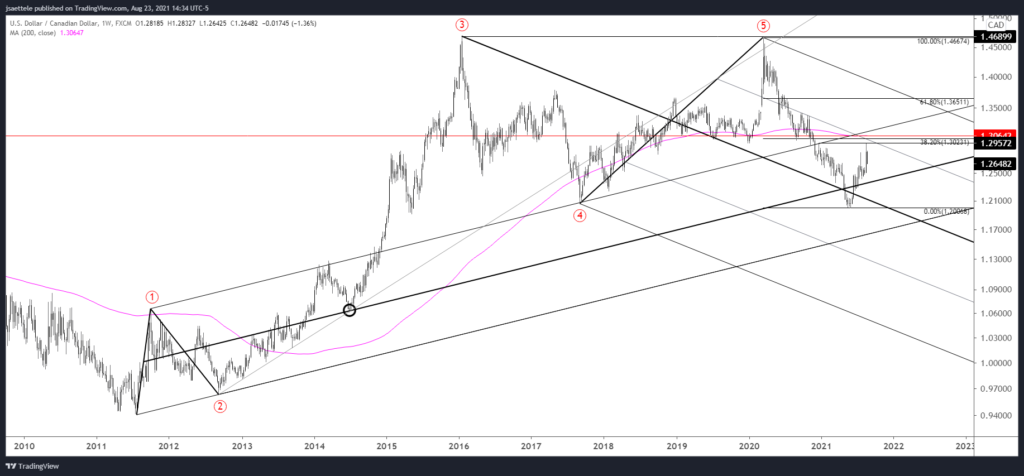
The following is from the Long Term Page (updated in June);
A double top is in play with the 2016 and 2020 highs (similar to the double bottom in GBPUSD) but allow for the shakeout with resistance centered on 1.3000.
High last week was 1.2949. Close enough? The drop appears impulsive so focus will be on identifying resistance following a rebound. 2 levels to keep in mind are the year open at 1.2721 and the 7/19 high at 1.2808. Watch for a bounce near 1.2589-1.2605 (former resistance).
USDTRY 4 HOUR

USDTRY rolled over just under 8.57. A head and shoulders top is possibly underway from the June high as well. A break under 8.28 would confirm the pattern. Proposed resistance is now 8.4950.
8/16 – USDTRY continues to weaken, in line with the bearish view. The next bounce will represent a great short opportunity. That level might be near 8.57, which is a well-defined horizontal level and currently the 200 period average on the 4 hour chart.